
Smoky Mountains | Vacation Rental Management
Is Your Smoky Mountains Cabin Performing Where It Should Be?
With year-round demand and 12 million annual visitors to the National Park, the Smokies should be one of the most reliable STR markets in the country. For most cabin owners, the gap between what they earn and what they could earn comes down to execution, not location.
Three remaining new client spots for 2026 season.
The Smokies Reward Execution, Not Just Location
The Great Smoky Mountains remain the most visited national park in the United States, drawing over 12 million visitors annually to Pigeon Forge, Gatlinburg, and Sevierville. Year-round demand, from fall foliage and holiday weekends to summer family travel and spring break, makes this one of the few STR markets where consistent revenue is possible across all four seasons.
But that same demand has attracted significant new supply. Cabin inventory continues to grow, and the properties that treat revenue management, listing optimization, and guest experience as an afterthought are already feeling the pressure. The gap between a well-managed cabin and an average one is getting wider with every booking season.
We built a comprehensive market report to give Smoky Mountain cabin owners a clear picture of where the market stands and what separates top performers from the rest.
The 2025 Smoky Mountains Luxury STR Profit Report
Year-round demand patterns and the seasonal booking windows that drive annual revenue
Cabin performance by bedroom count, amenity package, and proximity to attractionsroom count and water proximity
Platform dynamics: how Airbnb and VRBO perform differently in the Smokies market
Supply growth trends and what rising inventory means for your competitive position
The amenity premium: which features (hot tub, game room, mountain views) command the highest rates
The profit gap between average and top-quartile cabins in your bedroom segment
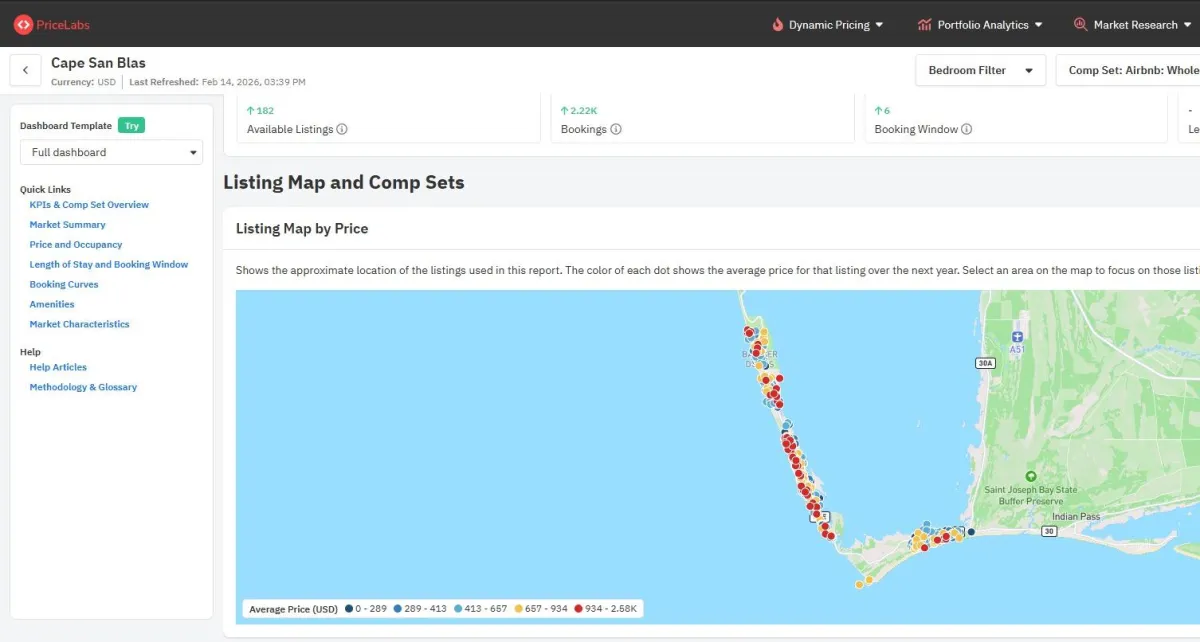
Built from listing-level performance data across Airbnb and VRBO in the Pigeon Forge, Gatlinburg, and Sevierville markets. 2026.
See Exactly Where Your Cabin Stands
The report covers the broader Smokies market. The Profit Gap Analysis is specific to your property — how your cabin compares to top performers in your bedroom count, your submarket, and your amenity tier, and what changes would have the highest revenue impact.
In 30 minutes, we'll show you:
Your specific profit gap number based on real market data
3–5 highest-impact changes ranked by revenue potential
How top-performing cabins in your segment are positioned differently
Whether professional management would improve your bottom line
Based on listing-level data across 1,300+ properties on Airbnb and VRBO. January 2026.
We are only onboarding 3 new management clients this quarter to maintain the quality our current owners expect. Peak booking windows for summer and fall travel are approaching — cabins that optimize now will capture the most value.
Vacation Rental Management Built for Mountain Market Owners
Endless Asset Management operates cabin and mountain home properties across the Smoky Mountains alongside a $17M portfolio spanning the Jersey Shore and Emerald Coast. We are not a volume manager trying to collect doors. Our founders are a CPA and a former investment banker who built and self-managed their own STR portfolios, including cabins in the Smokies before expanding to serve other owners. We bring the same financial discipline, hospitality standards, and hands-on attention to every property we take on.