
Jersey Shore | Vacation Rental Management
Your Shore Property Has Changed. Has Your Management Kept Up?
The Jersey Shore rental market looks nothing like it did five years ago. New technology, smarter pricing tools, platform-specific strategies, and rising competition have transformed what it takes to maximize a shore home's revenue.
Most traditional managers haven't adapted. The owners who recognize the gap are the ones pulling ahead.
Now accepting 3 new management clients for the 2026 shore season.
The Shore Isn’t Just a Summer Market Anymore
For decades, Jersey Shore property management meant one thing: fill the summer weeks and call it a year.
That approach may have worked in 2015. In 2026, it’s a liability.
Shoulder season demand is real and growing. Platform dynamics have shifted dramatically, with one major platform now generating 40–70% more revenue than the others in most Monmouth County beach towns. Meanwhile, supply is accelerating, with some towns doubling active listings year over year.
The data is clear: management quality alone can create a 50%+ revenue difference between comparable properties in the same town.
The owners earning the strongest returns aren’t the ones with the nicest homes.
They’re the ones with modern management — optimizing every booking window, every platform, and every season as a revenue opportunity.
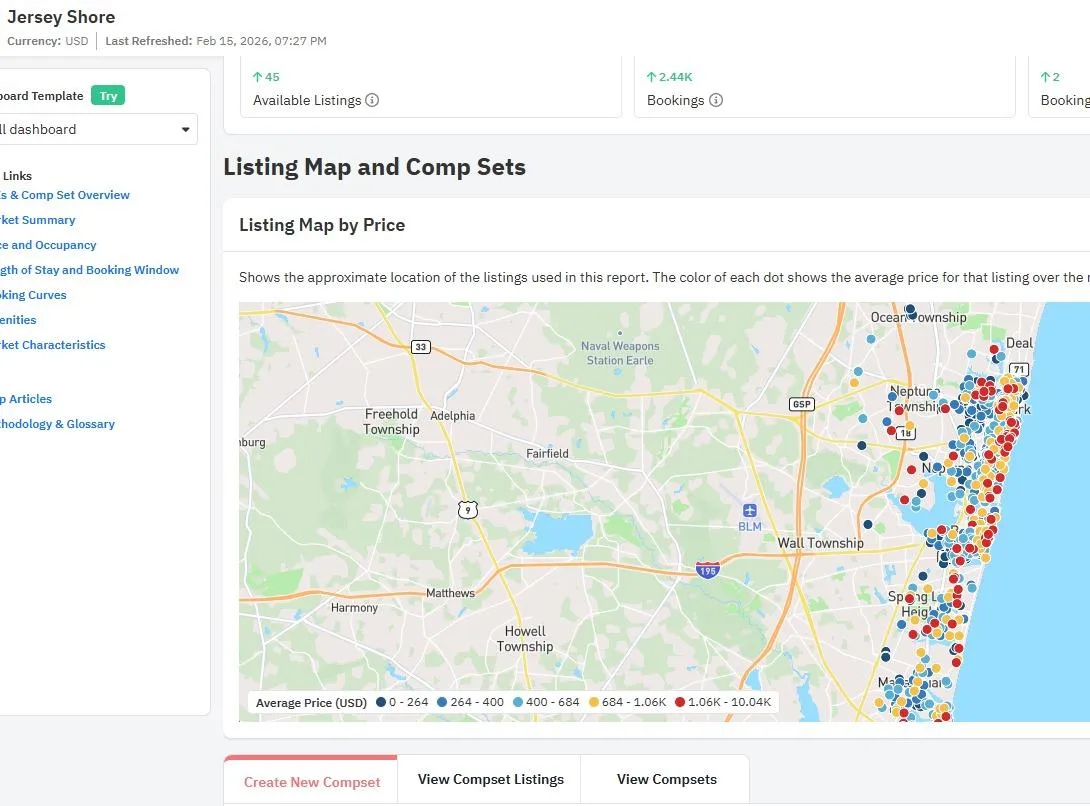
We built a comprehensive market report analyzing 2,700+ listings across Monmouth and Ocean Counties to show what’s actually happening — and where the biggest opportunities are hiding.
The 2025 Jersey Shore STR Market Report
Town-by-town revenue benchmarks for Belmar, Bradley Beach, Asbury Park, Ocean Grove, and beyond
The platform gap: which towns strongly favor one platform over the other — and by how much
The management quality multiplier and what separates top-performing listings from the rest
Shoulder and off-season demand patterns most owners are missing entirely
Amenity premiums: which upgrades command the highest returns at the shore
Amenity premiums: which upgrades command the highest returns at the shore
Built from listing-level performance data across 2,700+ properties on Airbnb and VRBO in Monmouth and Ocean Counties. 2026.
Find Out What Your Shore Home Is Leaving on the Table
The report covers the broader Jersey Shore market. The Profit Gap Analysis is specific to your property — how your home stacks up against the top performers in your town, your bedroom count, and your amenity profile, and which changes would make the biggest financial difference.
In 30 minutes, we'll show you:
Your property's specific revenue gap compared to top-quartile homes in your town
Which platform should be driving the majority of your bookings (and whether it currently is)
3–5 highest-impact optimizations ranked by projected revenue lift
Where your shoulder season revenue stands versus what's realistic with modern management
Based on listing-level data across 1,300+ properties on Airbnb and VRBO. January 2026.
We are only onboarding 3 new management clients this quarter to protect the service quality our current owners rely on. Summer booking windows on VRBO open months before Airbnb, shore homes that optimize now capture the highest-value reservations first.
Shore Property Management That Runs Like It's 2026
Endless Asset Management was founded on the Jersey Shore. Our co-founders are a CPA and a former investment banker who built and self-managed their own shore properties before creating EAM to serve other owners across a $17M portfolio.
We operate in Belmar, Bradley Beach, Ocean Grove, Asbury Park and surrounding towns with the same dynamic pricing, listing optimization, and multi-platform distribution strategies that have driven results across all of our markets.
This is not your parents' property manager.